The Ruthenium Market
Critical Minerals and The Energy Transition
An introduction to ruthenium
Ruthenium’s largest market is in electronic products, mainly chip resistors and hard disk drives, while catalysis and electrochemical (chloralkali process electrodes) are significant too.
Ruthenium has recently outperformed all the other PGMs, but rising prices increase the risk of price-induced substitution for existing end-uses and threaten ruthenium's place in the adoption zone for potential new end-uses.
SFA (Oxford) utilises its extensive expertise and knowledge of the ruthenium industry to provide an independent quarterly view, allowing you to keep up to date with this market and highlighting technological developments and the underlying evolution of demand and end-use applications.
Ruthenium price news and insights
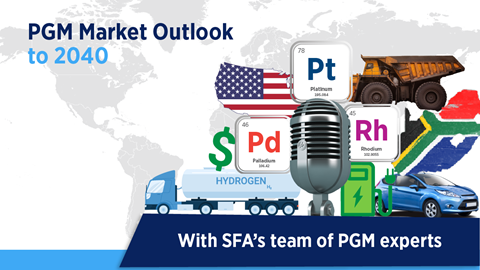
SFA's latest podcast: PGM markets out to 2040
11 November 2024
The latest SFA podcast episode examines how evolving trends in transportation and energy are reshaping the platinum group metals markets.

The squeeze is on: Managing the margins
10 September 2024 | Dr Ralph Grimble
PGM miners’ revenues have collapsed with the fall in palladium and rhodium prices. The little-mentioned chrome has become an important contributor.
Iridium’s outlook linked to hydrogen economy wariness
21 October 2024 | SFA (Oxford) & Heraeus
Chinese heavy-duty vehicle platinum demand could be ready for a rise
7 October 2024 | SFA (Oxford) & Heraeus
Where does the palladium market go from here?
23 September 2024 | SFA (Oxford) & Heraeus
The Chinese car market in 2024 – PHEVs, subsidies and palladium
19 August 2024 | SFA (Oxford) & Heraeus
Ruthenium price in context, 1995 to 2021

Ruthenium market balance
| koz | 2014 | 2015 | 2016 | 2017 | 2018 | 2019 | 2020 | 2021 | |
| Primary ruthenium supply | |||||||||
| South Africa | |||||||||
| Russia | |||||||||
| Zimbabwe | |||||||||
| Other | |||||||||
| Total ruthenium supply | 780 | 1,035 | 1,015 | 1,015 | 1,030 | 1,015 | 790 | 1,065 | |
| Ruthenium demand |
|||||||||
| Hydrogen | |||||||||
| Chemical | |||||||||
| Electrical | |||||||||
| Other | |||||||||
| Total ruthenium demand | 945 | 1,060 | 970 | 1,010 | 975 | 970 | 900 | 940 | |
| Ruthenium market balance | |||||||||
| Ruthenium balance | -165 | -25 | 45 | 5 | 55 | 45 | -110 | 125 | |
| Ruthenium price history | |||||||||
| Ruthenium price (USD/oz) | 65 | 47 | 42 | 75 | 241 | 258 | 265 | 565 | |
| Ruthenium price (GBP/oz) | 39 | 31 | 31 | 58 | 181 | 202 | 207 | 411 | |
| Ruthenium price (EUR/oz) | 49 | 43 | 38 | 66 | 205 | 231 | 232 | 479 | |
| Ruthenium price (CNY/oz) | 400 | 298 | 276 | 505 | 1,600 | 1,784 | 1,827 | 3,645 | |
| Ruthenium price (ZAR/oz) | 702 | 602 | 612 | 1,004 | 3,217 | 3,729 | 4,364 | 8,335 | |
| Ruthenium price (JPY/oz) | 6,840 | 5,744 | 4,523 | 8,442 | 26,649 | 28,175 | 28,266 | 62,407 | |
Source: SFA (Oxford). Updated November 2021.


Linked ruthenium market reports
In response to requests for more regular ruthenium market intelligence, we now produce a bespoke quarterly ruthenium market report that allows you to keep up to date with this market.

Meet the ruthenium team
Trusted advice from a dedicated team of experts.

Dr Jenny Watts
Head of Clean Energy & Sustainability

Alex Biddle
Senior Mining Analyst

Jamie Underwood
Principal Consultant

Dr Sandeep Kaler
Market Strategy Analyst

How can we help you?
SFA (Oxford) provides bespoke, independent intelligence on the strategic metal markets, specifically tailored to your needs. To find out more about what we can offer you, please contact us.
